Mastering the Maze: Evaluating ETF Liquidity with Confidence
In the diverse universe of Exchange-Traded Funds (ETFs), understanding liquidity is crucial for investors hoping to glide seamlessly in and out of trades. Navigating through the liquidity maze isn’t as overwhelming as it seems—especially when you’ve got the right toolkit. Today, we’ll unravel the mystery of evaluating ETF liquidity and why it’s a vital compass for potential investors.
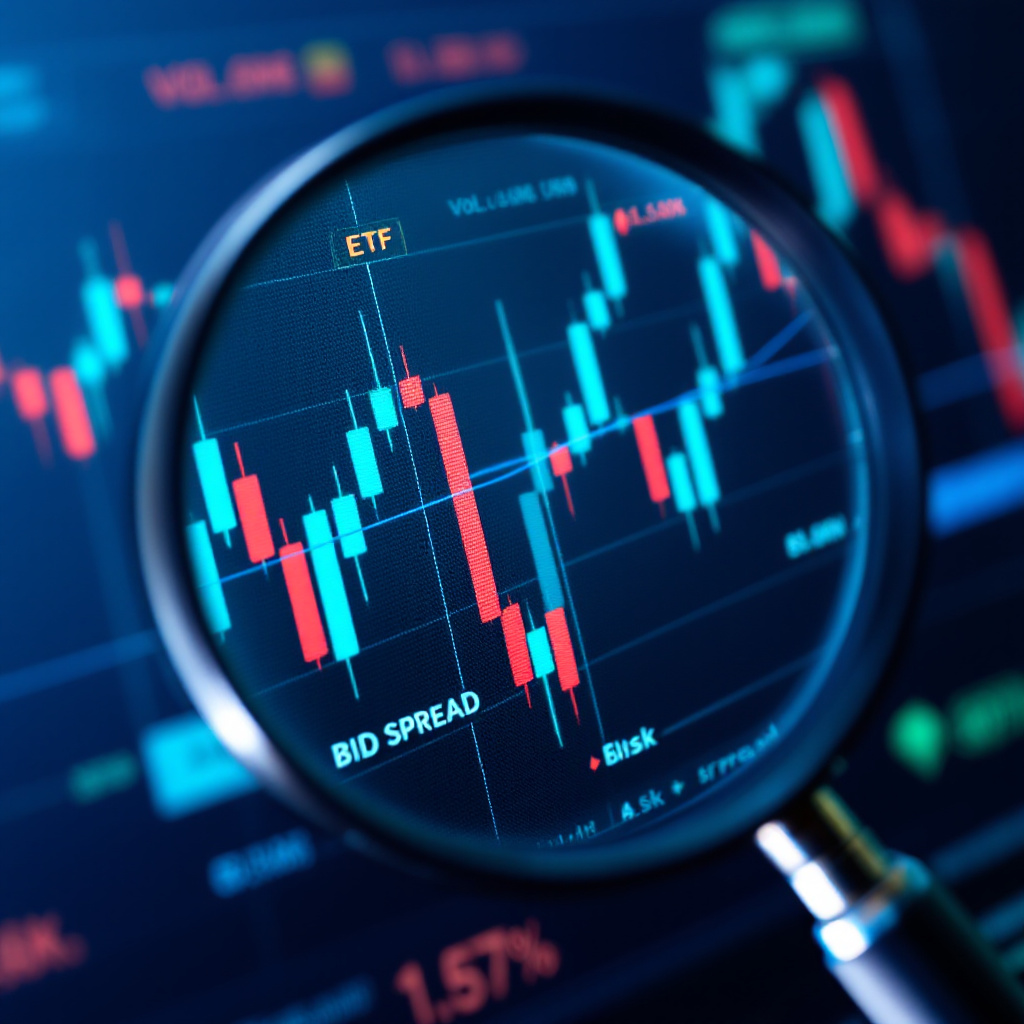
What Is ETF Liquidity, and Why Should It Matter to You?
When people talk about ETF liquidity, they’re really diving into how easily shares can be purchased or sold in the market without significantly affecting the ETF’s price. It’s like checking the depth of a pool before diving in. You wouldn’t want to leap into shallow waters, right?
Liquidity matters because it serves as a safety net against erratic market price swings. The more liquid an ETF is, the quicker—and usually cheaper—you can get out. If you’re an investor eyeing efficiency, liquidity should definitely hold a spot on your radar.
Breaking Down the Indicators: How to Evaluate ETF Liquidity
Alright, let’s cut to the chase—how do you evaluate ETF liquidity effectively? Understanding key indicators can make all the difference. Let’s explore these indicators one by one.
1. Trading Volume
Think of trading volume as the heartbeat of an ETF. A high trading volume signals a high level of investor interest, indicating that the fund’s shares are bought and sold frequently. Here’s why it’s important:
- High trading volumes generally translate to consistently traded prices, reducing the risk of untimely trades that could impact prices.
- With frequent trading, there’s a good chance of finding a willing buyer or seller quickly.
However, don’t be fooled! An ETF’s overall volume encompasses more than what meets the eye in secondary markets. More on this in the upcoming sections.
2. Bid-Ask Spreads
Next up: bid-ask spreads, the unsung hero of ETF liquidity metrics. This is the difference between the highest price a buyer is willing to pay and the lowest price a seller is willing to accept for the ETF. Small spreads are more appealing. Why?
- Narrow spreads imply a more efficient market, often denoting high liquidity.
- They keep transaction costs down, saving investors a pretty penny in the long run.
But wait—there’s more to this than meets the eye!
3. Premiums and Discounts
An ETF’s market price can occasionally deviate from its net asset value (NAV), leading to premiums (prices above NAV) or discounts (prices below NAV). Regular deviations can be a red flag when assessing liquidity:
- Frequent premiums or discounts highlight market inefficiencies, often driving investor skepticism.
- A substantial gap between NAV and market price signals liquidity issues, causing potential loss events.
Consistency—now there’s a game-changer!
The Invisible Factor: Assessing the Role of Authorized Participants (APs)
While trading volume and bid-ask spreads are handy indicators, they don’t paint the full picture. Dive deeper into an ETF’s primary liquidity channel: Authorized Participants (APs). They wear superhero capes, stepping in to create or redeem ETF shares to keep the ETF’s price close to its NAV.
Here’s how APs matter for liquidity:
- APs mitigate market price disparities by arbitraging, thus maintaining liquidity.
- The quality of APs associated with an ETF indicates a healthier, more robust liquidity stance.
For investors evaluating ETF liquidity, understanding the role of APs ensures a comprehensive insight into potential trades’ stability.
Real-world Tips on Choosing the Right ETF Based on Liquidity
Interested in applying these insights practically? Fear not! Here are some tested tips for choosing ETFs with great liquidity:
1. Look Beyond Trading Volume
- Acknowledge the ETF’s total trading volume, accounting for primary and secondary markets.
- Analyzing liquidity according to daily volumes, such as how it holds during wake hours and sluggish sessions, can offer deeper insights.
2. Focus on Tight Spreads
- Tight spreads lower transaction expenses—ideal for capturing gains on short-lived trades.
- Don’t just glance over; continually monitor spreads as they fluctuate with changes in market conditions.
3. Check NAV Alignments
- Frequent misalignment between market price and NAV demands a keener look. Spotty alignments flag liquidity loopholes!
- Pay attention to consistent alignment to navigate smoothly through turbulent market waves.
4. Study the Authorized Participants
- Know your APs. Seek ETFs managed by APs with stellar reputations—trusted APs assure smoother price alignment and stability.
- The more APs involved, the merrier! A diverse AP pool strengthens maintenance of efficient liquidity flows.
A Wrinkle in the Road: Liquidity during Market Crises
Oh boy, slippery slope ahead! Market upheaval can shake liquidity fundamentals. Investors should remain vigilant during these treacherous times, understanding that liquidity can dwindle as volatility spikes.
Here’s how you can navigate efficiently during crises:
- Reassess the indicators consistently, adapting strategies as spreads widen or volumes decrease.
- Prepare for potential selling constraints by evaluating ETF performance during previous market crises.
- Trust your plan: have your investment strategy etched in stone so you aren’t tempted to make swift decisions based on panic.
In Conclusion: Mastering Liquidity for a Seamless ETF Experience
While evaluating ETF liquidity may seem daunting at first glance, it becomes second nature with a firm grasp on key indicators like trading volume, bid-ask spreads, NAV alignments, and the involvement of APs. Knowledge, after all, is power!
With these insights, your ETF quest won’t just be another investment ride—it’ll be an informed journey, sparing you from chaotic trades and unnecessary costs. So next time you venture into the ETF market, remember you’ve got the tools to evaluate liquidity and the confidence to swim even in deep waters. Happy trading!
FAQs
How to assess liquidity of an ETF?
The process of evaluating ETF liquidity involves a couple of key factors. First and foremost, look at the trading volume of the ETF—this is a prime indicator of its liquidity. Higher trading volumes typically reflect higher liquidity, as more buyers and sellers are active in the market. Additionally, pay attention to the average bid-ask spread. The smaller the spread, the better the liquidity, since it implies that the market is efficient and transaction costs are lower.
What is the liquidity rule for ETFs?
The Liquidity Rule is pivotal for fund management. Essentially, it mandates that a fund consider how quickly it expects an investment to convert to cash without significantly altering the investment’s market value. This assessment is vital to determine whether an investment can be categorized as highly liquid or moderately liquid.
Which ETF has the highest liquidity?
When it comes to ETFs with the highest liquidity, trading volume plays a crucial role. Among large-cap ETFs, Nippon India ETF Nifty 50 BeES leads the pack with the highest 1-year average trading volume of Rs. 80.12 crore. It is closely followed by SBI Nifty 50 ETF, which boasts a trading volume of Rs. 26.4 crore, and Nippon India ETF Nifty Next 50 Junior BeES, demonstrating that robust volumes translate to better liquidity.